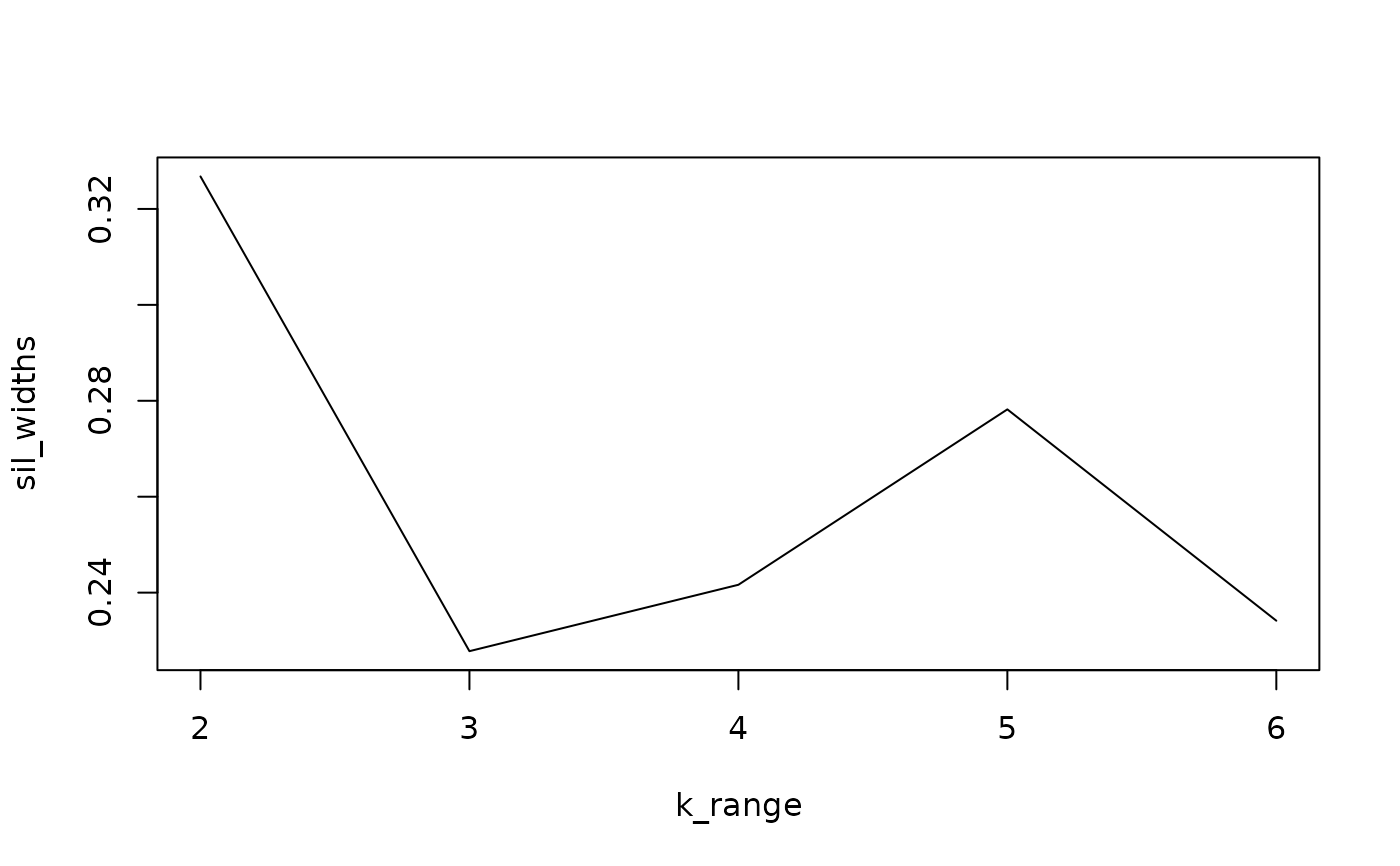
Return a silhouette score plot to visualize how well PAM clusters are defined, for each number of clusters k in the k range.
Source:R/plotters.R
tacoplot_silhouette_width.RdReturn a silhouette score plot to visualize how well PAM clusters are defined, for each number of clusters k in the k range.
Examples
urt %>% tacoplot_silhouette_width(2:6)
#> Warning: No phylogenetic tree found, generating tree using msa of the 'sequence' column.
#> Determining distance matrix based on shared 8-mers:
#> ================================================================================
#>
#> Time difference of 20.75 secs
#>
#> Clustering into groups by similarity:
#> ================================================================================
#>
#> Time difference of 0.49 secs
#>
#> Aligning Sequences:
#> ================================================================================
#>
#> Time difference of 9.45 secs
#>
#> Iteration 1 of 2:
#>
#> Determining distance matrix based on alignment:
#> ================================================================================
#>
#> Time difference of 2.16 secs
#>
#> Reclustering into groups by similarity:
#> ================================================================================
#>
#> Time difference of 0.56 secs
#>
#> Realigning Sequences:
#> ================================================================================
#>
#> Time difference of 5.42 secs
#>
#> Iteration 2 of 2:
#>
#> Determining distance matrix based on alignment:
#> ================================================================================
#>
#> Time difference of 2.02 secs
#>
#> Reclustering into groups by similarity:
#> ================================================================================
#>
#> Time difference of 0.6 secs
#>
#> Realigning Sequences:
#> ================================================================================
#>
#> Time difference of 1.24 secs
#>
#> Refining the alignment:
#> ================================================================================
#>
#> Time difference of 0.12 secs
#>
#>
#> Attaching package: ‘phyloseq’
#> The following objects are masked from ‘package:tidytacos’:
#>
#>     filter_taxa, rank_names