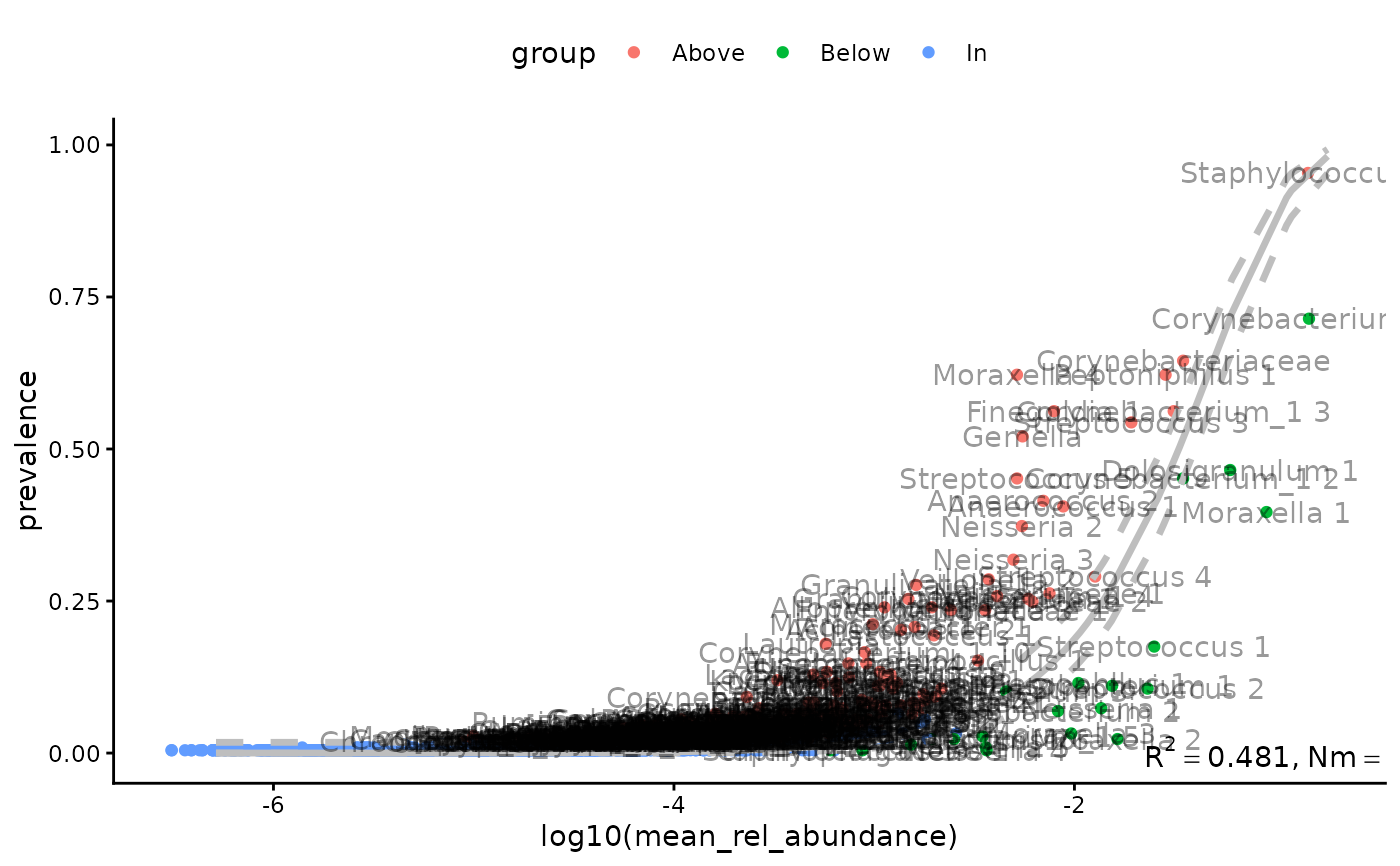
Return an occupancy-abundance plot to visualize the core taxa of a community.
Source:R/plotters.R
tacoplot_occupancy.RdReturn an occupancy-abundance plot to visualize the core taxa of a community.
Arguments
- ta
A tidytacos object of the community in question.
- taxon_name
the name of the taxa table column to perform the fit on.
- ...
Arguments passed on to
perform_neutral_modelmodelthe fit method to be used; choice from "nls" or "mle".
Examples
urt %>% tacoplot_occupancy()
#> Warning: NaNs produced
#> Warning: NaNs produced
#> Warning: NaNs produced
#> Joining with `by = join_by(taxon_id)`